In order to track performance of various parts of Open Sea, I decided to add a profiler.
The idea is to track the execution time of certain sections of the code each frame.
The requirements I had were both a text and graphical display, and ease of use.
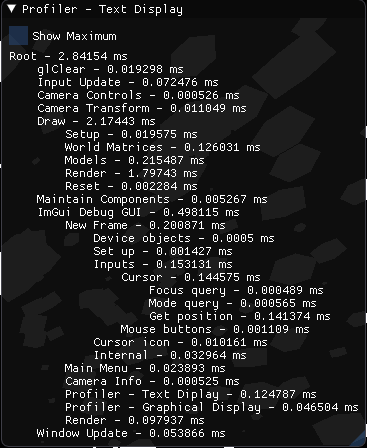
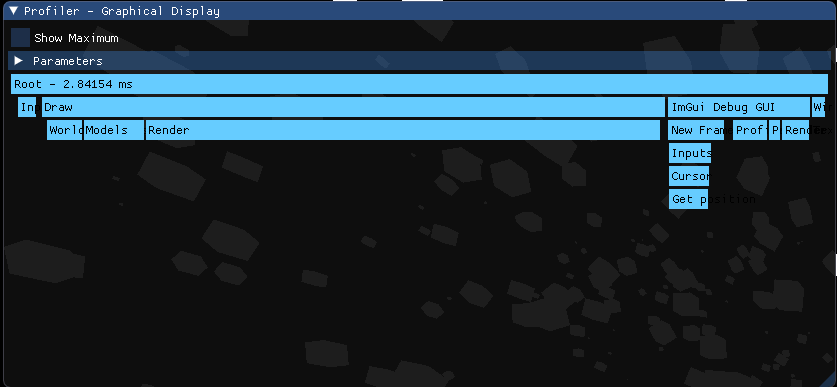
The text display is there to provide exact time measurements for comparison, while the graphical display shows how long the various sections take in relation to each other.
Ease of use is very important for the same reason as with ImGui.
It makes sure that I am never discouraged from profiling because it would involve too much work.
The code is contained in the open_sea::profiler namespace and the pull request is available here.
The data structure used to hold the profiling data for a frame is a Track, which is described in its own article.
Profiling Code
When you want to profile a frame, you need to start the profiling at the very start of the frame, then push and pop sections of the code on the stack, and at the end finish the profiling. Each of these is a simple function call to make it easy and concise.
All the functions are safe to call even if profiling hasn’t been started. In that case, they will have no effect.
Starting
By calling start(), you prepare a new Track for this frame.
This also pushes a “Root” node onto it, to represent the whole frame.
Pushing and Popping
To push a new section of code, just call push(label) where label is the desired label for this section.
This label will be used when displaying the frame data.
To mark the end of the section of code, you need to pop it by calling pop().
This is where the actual execution time is saved into the node.
Finishing
At the end of the frame, call finish() to finish the profiling.
This will pop the root node and copy the data for storage.
Every frame is copied into a “completed” slot, which signifies that this is the last completely profiled frame.
It is also copied into the “maximum” slot, if its root took longer to execute than the one previously in the “maximum slot” (or it was empty).
Displaying the Data
As mentioned earlier, there are two displays, both of which are meant to be used in ImGui windows.
Text
The frame data can be displayed as an indented string. This results in each section of code being on its own line with its label and execution time. Each line is indented based on the hierarchy of the code, with the root node having no indentation.
This display is intended to be used to get exact times for the sections of code as well as to see their hierarchy. It is ill suited to understanding the relative execution times of the various sections.

Graphical
The graphical display complements the text display by showing the relative execution times. Each level of the section hierarchy is represented as a line, with each section being shown as a bar on the line with width proportional to its execution time. The root node takes up the whole width of the window, and all other nodes take up a part of the width in proportion to the ratio of their execution time to the root’s.
Any sections that would be smaller than a specific width are omitted. By default, this width is 10 px. This, along with other parameters, can be adjusted in a menu shown above the bars.

Future Extensions
Currently, the profiler is geared towards a single-threaded application. I am planning an extension to the profiler that would take care of tracking multiple threads, but I will implement that after I have some substantial task running in parallel. This will give me a real sample to test with. Other than that, I plan to split up the code into more sections for more detailed profiling, and to implement various optimisations based on the information gathered.
I also have some small changes in mind for the Track, which I will implement once I have gone over the design a bit more and made sure it makes sense.